B2B SaaS Funnel Conversion Benchmarks 2026: Every Stage, With Sources
Sourced conversion benchmarks for each stage of the B2B SaaS funnel, from landing page to closed-won, plus growth and retention medians, and why the numbers you find online disagree.
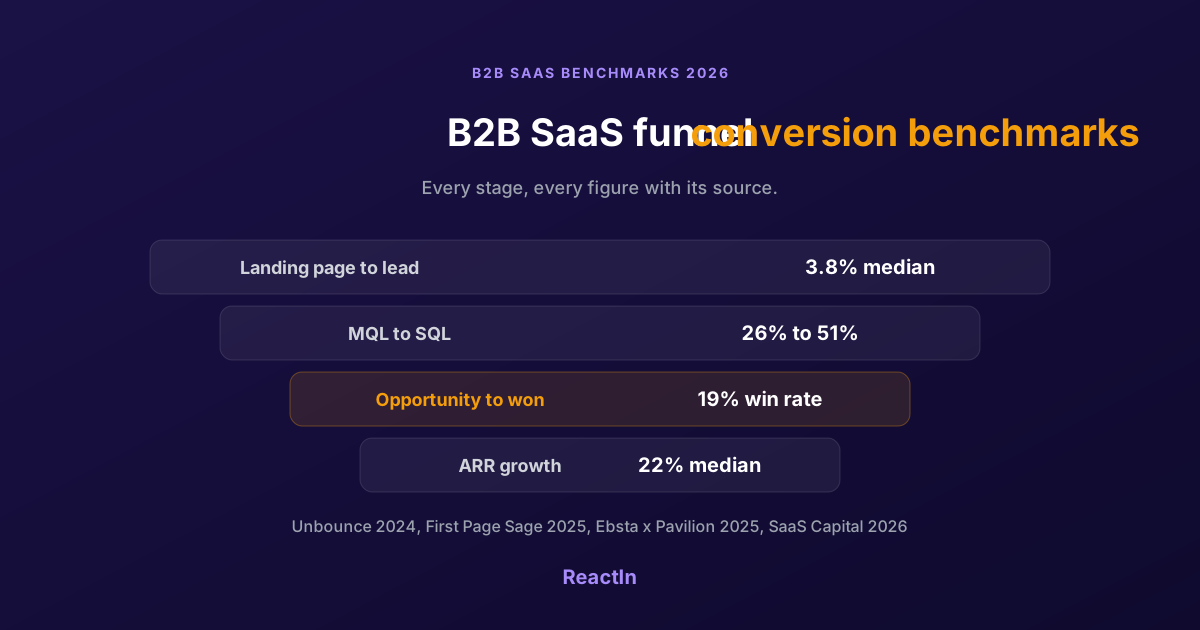
Your board deck says 1.8% of visitors become leads and one opportunity in five closes. Someone asks whether that is good. You search for B2B SaaS conversion benchmarks and find five numbers that disagree, most of them with no source at all.
This page collects the B2B SaaS funnel conversion benchmarks that have a public, named source, stage by stage, from the first visit to closed-won and then to growth. Every figure carries its publisher and year. The section on why benchmarks disagree tells you which one to compare yourself against, and which ones to ignore.
Figures checked on 23 September 2026. Each benchmark links to its publisher: check the page for a newer edition before you quote it.
B2B SaaS Conversion Benchmarks at a Glance
One row per funnel stage, with the figure most often quoted and where it comes from. Read the stage definitions below before comparing: a lead in one report is an MQL in another.
| Funnel stage | Benchmark | Source |
|---|---|---|
| Landing page visitor to conversion (SaaS) | 3.8% median | Unbounce, 2024 |
| Website visitor to signup (product-led) | About 6% freemium, 3 to 4% free trial | OpenView product benchmarks |
| Signup to activated user | 37.5% average | Userpilot, 2024 |
| Free to paid | About 5% freemium, about 17% free trial | OpenView product benchmarks |
| MQL to SQL | 26% (paid search) to 51% (SEO) | First Page Sage, 2025 |
| Opportunity to closed-won | 19% average win rate | Ebsta x Pavilion, 2025 |
| Annual revenue growth (private B2B SaaS) | 22% median in 2025 | SaaS Capital, 2026 survey |
| Net revenue retention | 101% median | SaaS Capital, 2025 |
Medians and averages from different samples. They are not links of one chain: multiplying them together gives a funnel that no real company has.
B2B SaaS Marketing Funnel: the Stages
A B2B SaaS marketing funnel is the sequence of stages a buyer crosses between a first visit and a signed contract: visitor, lead, marketing qualified lead (MQL), sales qualified lead (SQL), opportunity, customer. Each transition has its own conversion rate, and the product of those rates is the efficiency of your funnel.
- Visitor: a unique person on your site or on a landing page.
- Lead: a visitor who left contact details, through a form, a demo request, a signup or a content download.
- MQL: a lead that fits your ideal customer profile and has shown some intent. This is where definitions drift the most from one company to the next.
- SQL: an MQL that sales has vetted and that has a meeting booked or held.
- Opportunity: a qualified deal in the pipeline, with a buying process and usually an amount.
- Customer: a closed-won deal. In a subscription business the funnel does not stop here: retention and expansion decide how much of it turns into growth.
Product-led SaaS replaces part of this chain with signup, activation and upgrade. Sales-assisted SaaS runs both: product usage creates leads that sales then works. The benchmarks below follow that split.
B2B SaaS Conversion Rate Benchmarks by Stage
Three stages of the classic funnel have a benchmark with a public source and a sample large enough to mean something.
Visitor to lead: landing pages
Unbounce analysed 57 million conversions across more than 41,000 landing pages. The median SaaS landing page converted at 3.8%, against 6.6% across all industries (Unbounce Conversion Benchmark Report, 2024). This is a landing page figure. A whole website, with its blog, docs and careers traffic, converts far lower, so do not hold your site-wide rate against it.
MQL to SQL: it depends on the channel
First Page Sage publishes B2B SaaS funnel benchmarks drawn from its client base, mostly companies between $10M and $100M in revenue. The MQL to SQL rate it reports almost doubles from the weakest channel to the strongest (First Page Sage, B2B SaaS funnel benchmarks, 2025):
| Lead source | MQL to SQL |
|---|---|
| SEO | 51% |
| 46% | |
| Webinars | 39% |
| 30% | |
| Paid search (PPC) | 26% |
The gap is intent. Someone who found you while searching for their problem is further along than someone who clicked an ad. A blended MQL to SQL rate says more about your channel mix than about your sales team.
Opportunity to closed-won
The Ebsta x Pavilion 2025 GTM Benchmarks, built on 655,000 opportunities and $48 billion of pipeline, put the average B2B win rate at 19% (Ebsta x Pavilion, 2025). At that rate a team needs more than five times its target in pipeline to hit the number. That arithmetic is why most funnels get fixed upstream rather than at the close.
Why B2B SaaS Funnel Benchmarks Disagree
Search for a B2B SaaS conversion rate and you will find 2%, 5%, 13% and 40% for what looks like the same step. They are rarely wrong. They measure different things.
- Different definitions. One report counts any form fill as a lead, another only demo requests. An MQL can mean profile fit, or profile fit plus a behaviour threshold. Change the definition and the rate moves several times over.
- Page versus site. A landing page built for one offer converts far better than a whole website. Compare a landing page benchmark with your site-wide rate and you will conclude you are failing when you are not.
- Who is in the sample. An agency's clients, a tool's users and a survey's respondents are not the market. Companies that answer benchmark surveys tend to be the ones with numbers they are happy to share.
- Channel mix. As the table above shows, the same stage converts at 26% or 51% depending on where the lead came from. A blended benchmark hides the difference that matters.
SaaS Conversion Funnel for Product-Led Growth
In a product-led SaaS conversion funnel, the lead is a signup and the conversion that pays is free to paid. The two common models behave very differently.
| Model | Visitor to signup | Signup to paid |
|---|---|---|
| Freemium | About 6% | About 5% |
| Free trial | 3 to 4% | About 17% |
These are OpenView's product benchmarks, from a survey of more than 450 software companies (OpenView, product-led growth benchmarks). Freemium fills the top of the funnel, and the deadline of a trial converts better. The data predates 2024, so read it as an order of magnitude rather than a target.
Between signup and payment sits activation: the moment a user gets the value they signed up for. Userpilot measured an average activation rate of 37.5% across 62 B2B SaaS companies (Userpilot, 2024). Six signups in ten never reach that moment, which is why activation is often the cheapest stage of a product-led funnel to improve.
B2B SaaS Sales Funnel: from First Meeting to Closed-Won
The B2B SaaS sales funnel starts where marketing hands over: SQL, discovery, opportunity, proposal, closed-won. Two sets of published data frame it in 2026.
- Win rates are low. 19% on average in the Ebsta x Pavilion 2025 data. Four opportunities in five do not close, so both pipeline volume and pipeline quality decide the quarter.
- Buyers want fewer sales conversations. In a Gartner survey of 632 B2B buyers, 61% said they prefer a rep-free buying experience (Gartner, June 2025). The next edition, 646 buyers surveyed in 2025, put that share at 67% (Gartner, March 2026).
Together they explain the shape of a modern B2B SaaS sales funnel. Buyers do most of the research alone, then talk to a seller late and briefly. The conversation you do get has to be the right one, with the right person, at the right time.
Where Outbound and Intent Signals Fit in the Funnel
The same 2025 Gartner survey found that 73% of B2B buyers actively avoid suppliers who send irrelevant outreach. That is the case against volume outbound, and the case for outbound triggered by a signal.
An intent signal is something a prospect just did: commented on a post about the problem you solve, followed a competitor, visited your profile, changed jobs. Outreach built on it is relevant by construction, because it answers something the person did this week. It acts on the lead to meeting step, the one outbound owns and inbound benchmarks never measure.
This is what ReactIn does on LinkedIn: it turns engagement signals into lead lists and sends the invitation and the first message. For concrete playbooks, see 18 intent-based marketing automations. For where signal-based outbound sits next to CRM, enrichment and email tools, see the B2B SaaS GTM stack.
How to Measure B2B SaaS Growth
Conversion rates explain growth; they are not growth. Three numbers sum it up, and each has a public benchmark for private B2B SaaS companies.
- ARR growth rate. ARR today minus ARR a year ago, divided by ARR a year ago. SaaS Capital's 2026 survey of more than 1,000 private B2B SaaS companies found a median of 22% for 2025: 20% for bootstrapped companies and 25% for equity-backed ones (SaaS Capital growth benchmarks).
- Net revenue retention (NRR). This year's revenue from last year's customers, expansion included, divided by their revenue last year. The 2025 median is 101% (SaaS Capital retention benchmarks).
- Gross revenue retention (GRR). The same ratio without expansion, so it can never exceed 100%. The 2025 median in the same SaaS Capital report is 91%.
Read the three together. New customers come from the funnel above; retention decides how much of that growth you keep. SaaS Capital also finds that growth rises with net retention, so a funnel fix and a churn fix compound.
Past the early stage, the Rule of 40 is the usual shortcut to weigh growth against burn: growth rate plus profit margin, both in percent, should reach 40.
How to Improve B2B SaaS Funnel Conversion
Five moves, in the order that usually pays back fastest.
Measure per channel, not blended
Split every stage rate by lead source. The fix for a weak paid search funnel is not the fix for a weak outbound funnel, and a blended rate hides which one you have.
Write your definitions down
Agree with sales, in writing, on what a lead, an MQL and an SQL are. Half of the MQL to SQL arguments are definition arguments.
Fix the leakiest stage first
Compare each stage with a benchmark whose definitions match yours. The stage furthest below it is where one change moves revenue the most. In product-led funnels, it is often activation.
Move budget toward intent
The channels where the buyer came looking, such as search, referrals and email to an engaged list, convert better further down. Shift budget to them before you buy more top-of-funnel volume.
Make outbound relevant
Replace list-based cold outreach with outreach triggered by a signal. Buyers avoid suppliers who send irrelevant messages. They answer the ones who noticed what they just did.
For the LinkedIn side of that last step, the LinkedIn prospecting guide covers list building, sequencing and daily limits.
Frequently Asked Questions
Sources & Further Reading
- First Page Sage: B2B SaaS Funnel Conversion Benchmarks (2025 update, client data from B2B SaaS companies).
- Unbounce: SaaS conversion rate benchmark (2024, 41,000 landing pages).
- OpenView: Your Guide to Product-Led Growth Benchmarks (freemium and free trial conversion).
- Userpilot: User Activation Rate Benchmark Report 2024.
- Ebsta x Pavilion: 2025 GTM Benchmarks (655,000 opportunities).
- Gartner: 61% of B2B buyers prefer a rep-free buying experience (press release, June 2025).
- SaaS Capital: Private B2B SaaS Company Growth Rate Benchmarks (2026 survey).
- SaaS Capital: What is a good retention rate for a private SaaS company? (2025 benchmarks).
Related Articles
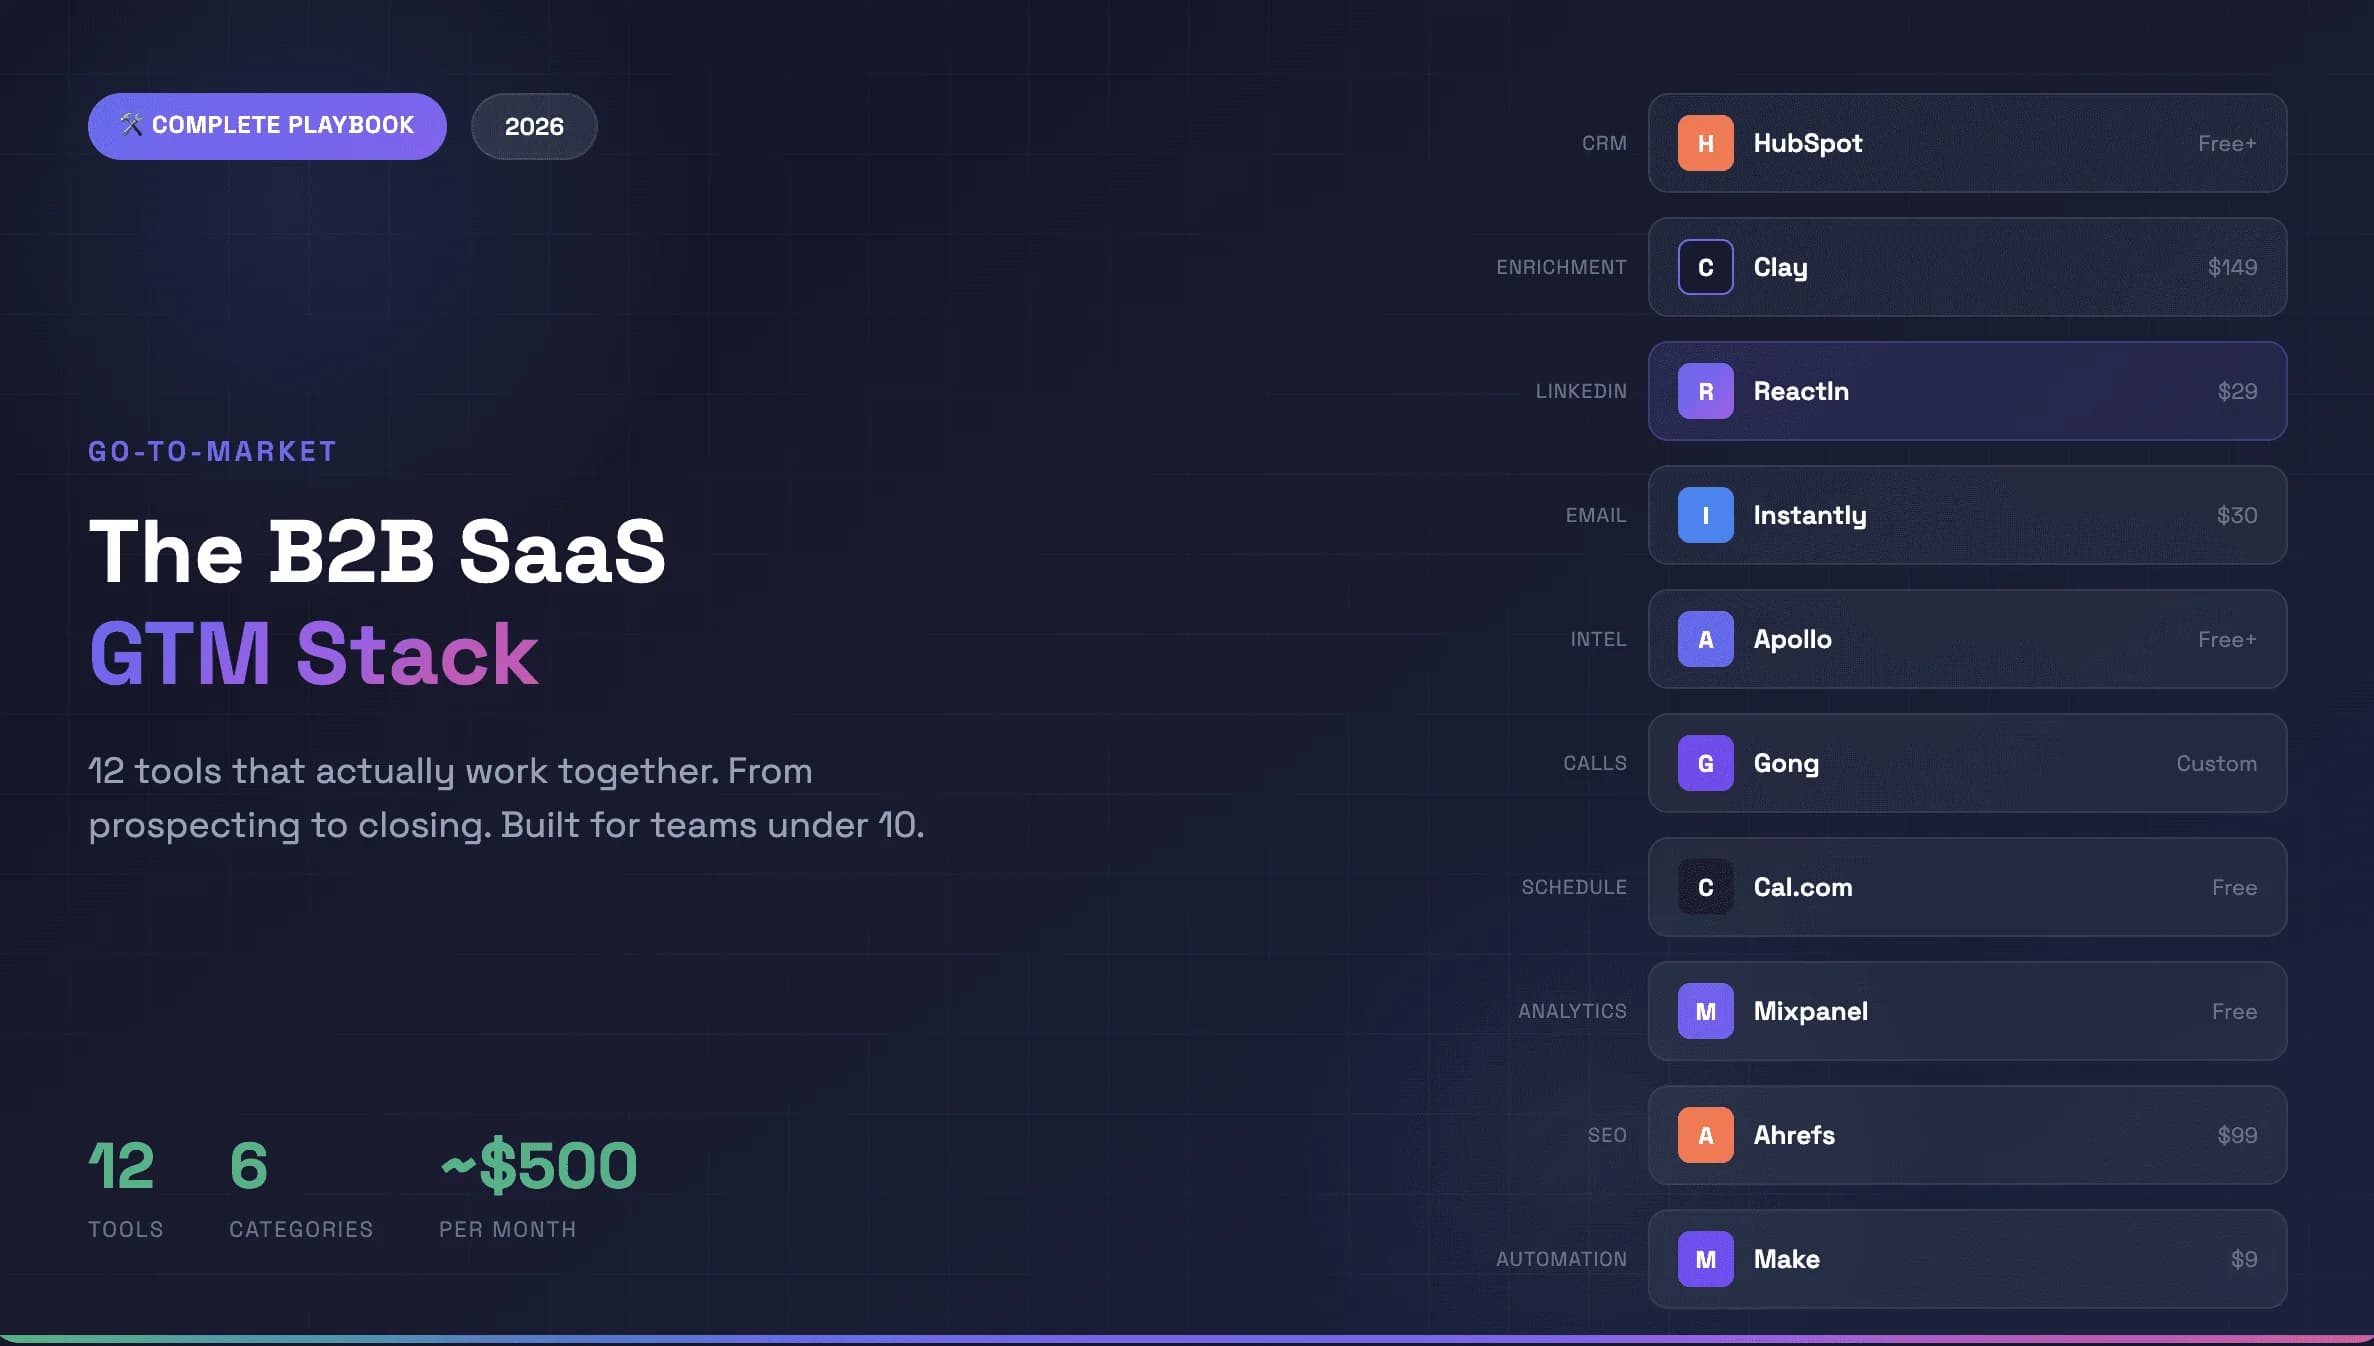
Best Go-to-Market Tools for B2B SaaS 2026: The 12-Tool GTM Stack
The best go-to-market tools for B2B SaaS in 2026. A complete 12-tool GTM stack with automation platforms that actually integrate - from prospecting to closing, built for scaling SaaS businesses. ~$500/month total.
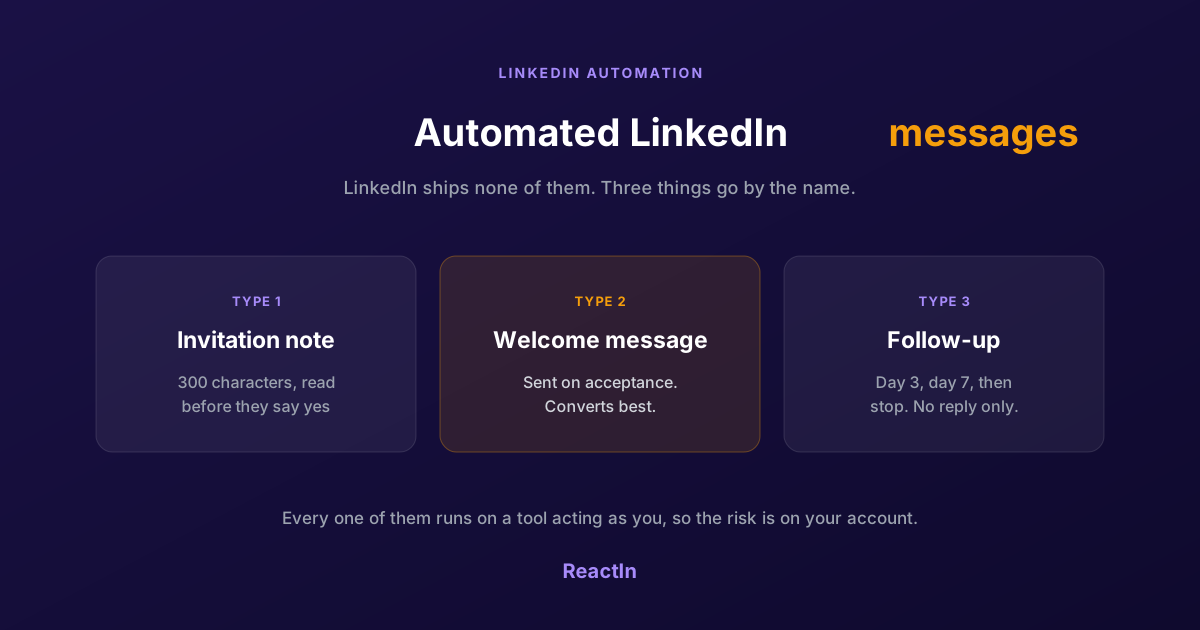
Automated LinkedIn Messages: How to Send Them Without Getting Restricted (2026)
LinkedIn ships no automated messaging at all. Here are the three things people call an automated LinkedIn message, how to set one up, what the terms actually say, and the three cases where writing by hand wins.
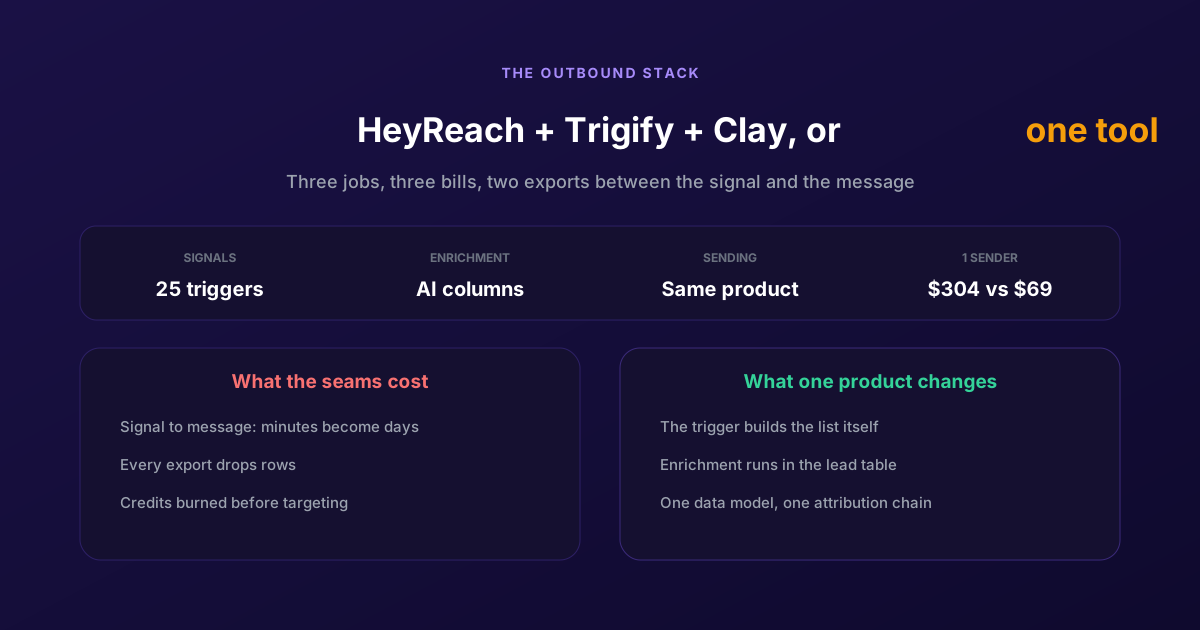
ReactIn = HeyReach + Trigify + Clay: One Tool for Cold and Warm Outreach
Three products, three bills, and two exports between the signal and the message. Here is what each tool owns, what the seams cost in latency and credits, and when keeping the stack is still the right call.
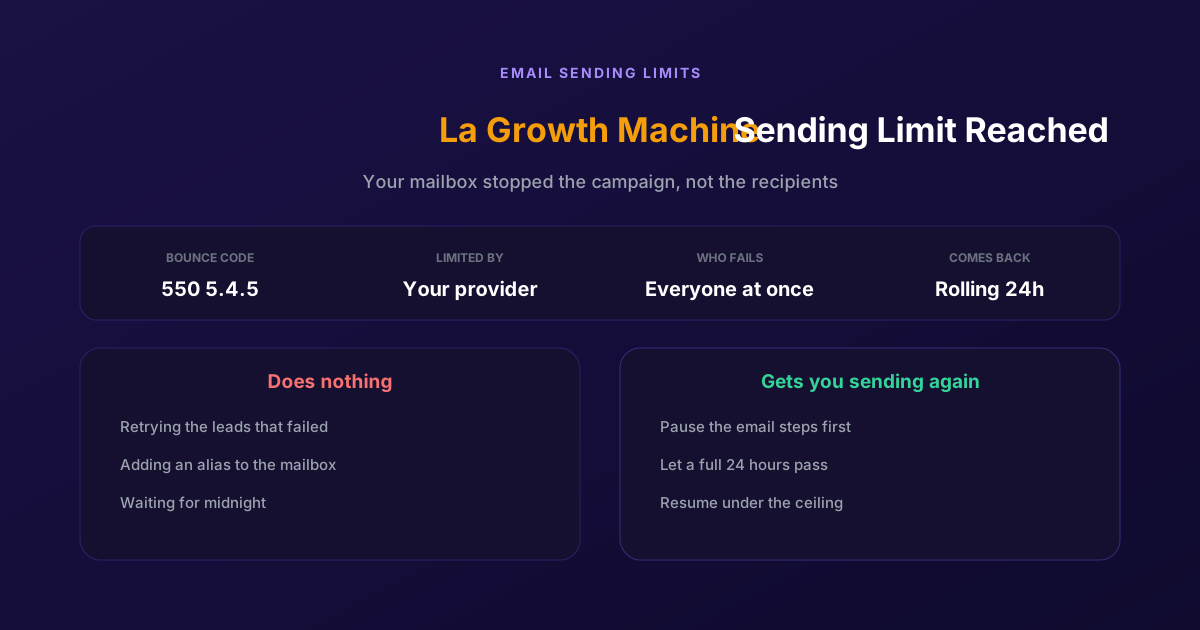
Fix "You Have Reached a Limit for Sending Mail" in La Growth Machine
The message belongs to your email provider, not to the tool. The mailbox has spent its daily allowance, every recipient fails at once, and capacity comes back on a rolling 24-hour window rather than at midnight.