Campaign Statistics: Invite Acceptance & Reply Rate
ReactIn tracks key performance metrics across all your campaigns, so you can understand what’s working, what’s underperforming, and where to optimize.
📊 Core campaign metrics
For every campaign, ReactIn shows real-time performance indicators, including:
| Metric | What it tells you |
|---|---|
| Invitations Sent | How many LinkedIn connection requests were sent |
| Acceptance Rate | % of people who accepted your invite |
| Messages Sent | Number of 1st-degree messages successfully delivered |
| Reply Rate | % of leads who replied (total replies ÷ messages sent) |
You’ll find these metrics in:
-
The Campaigns tab
-
By clicking on any active or past campaign
-
In the Analytics section of the campaign detail page
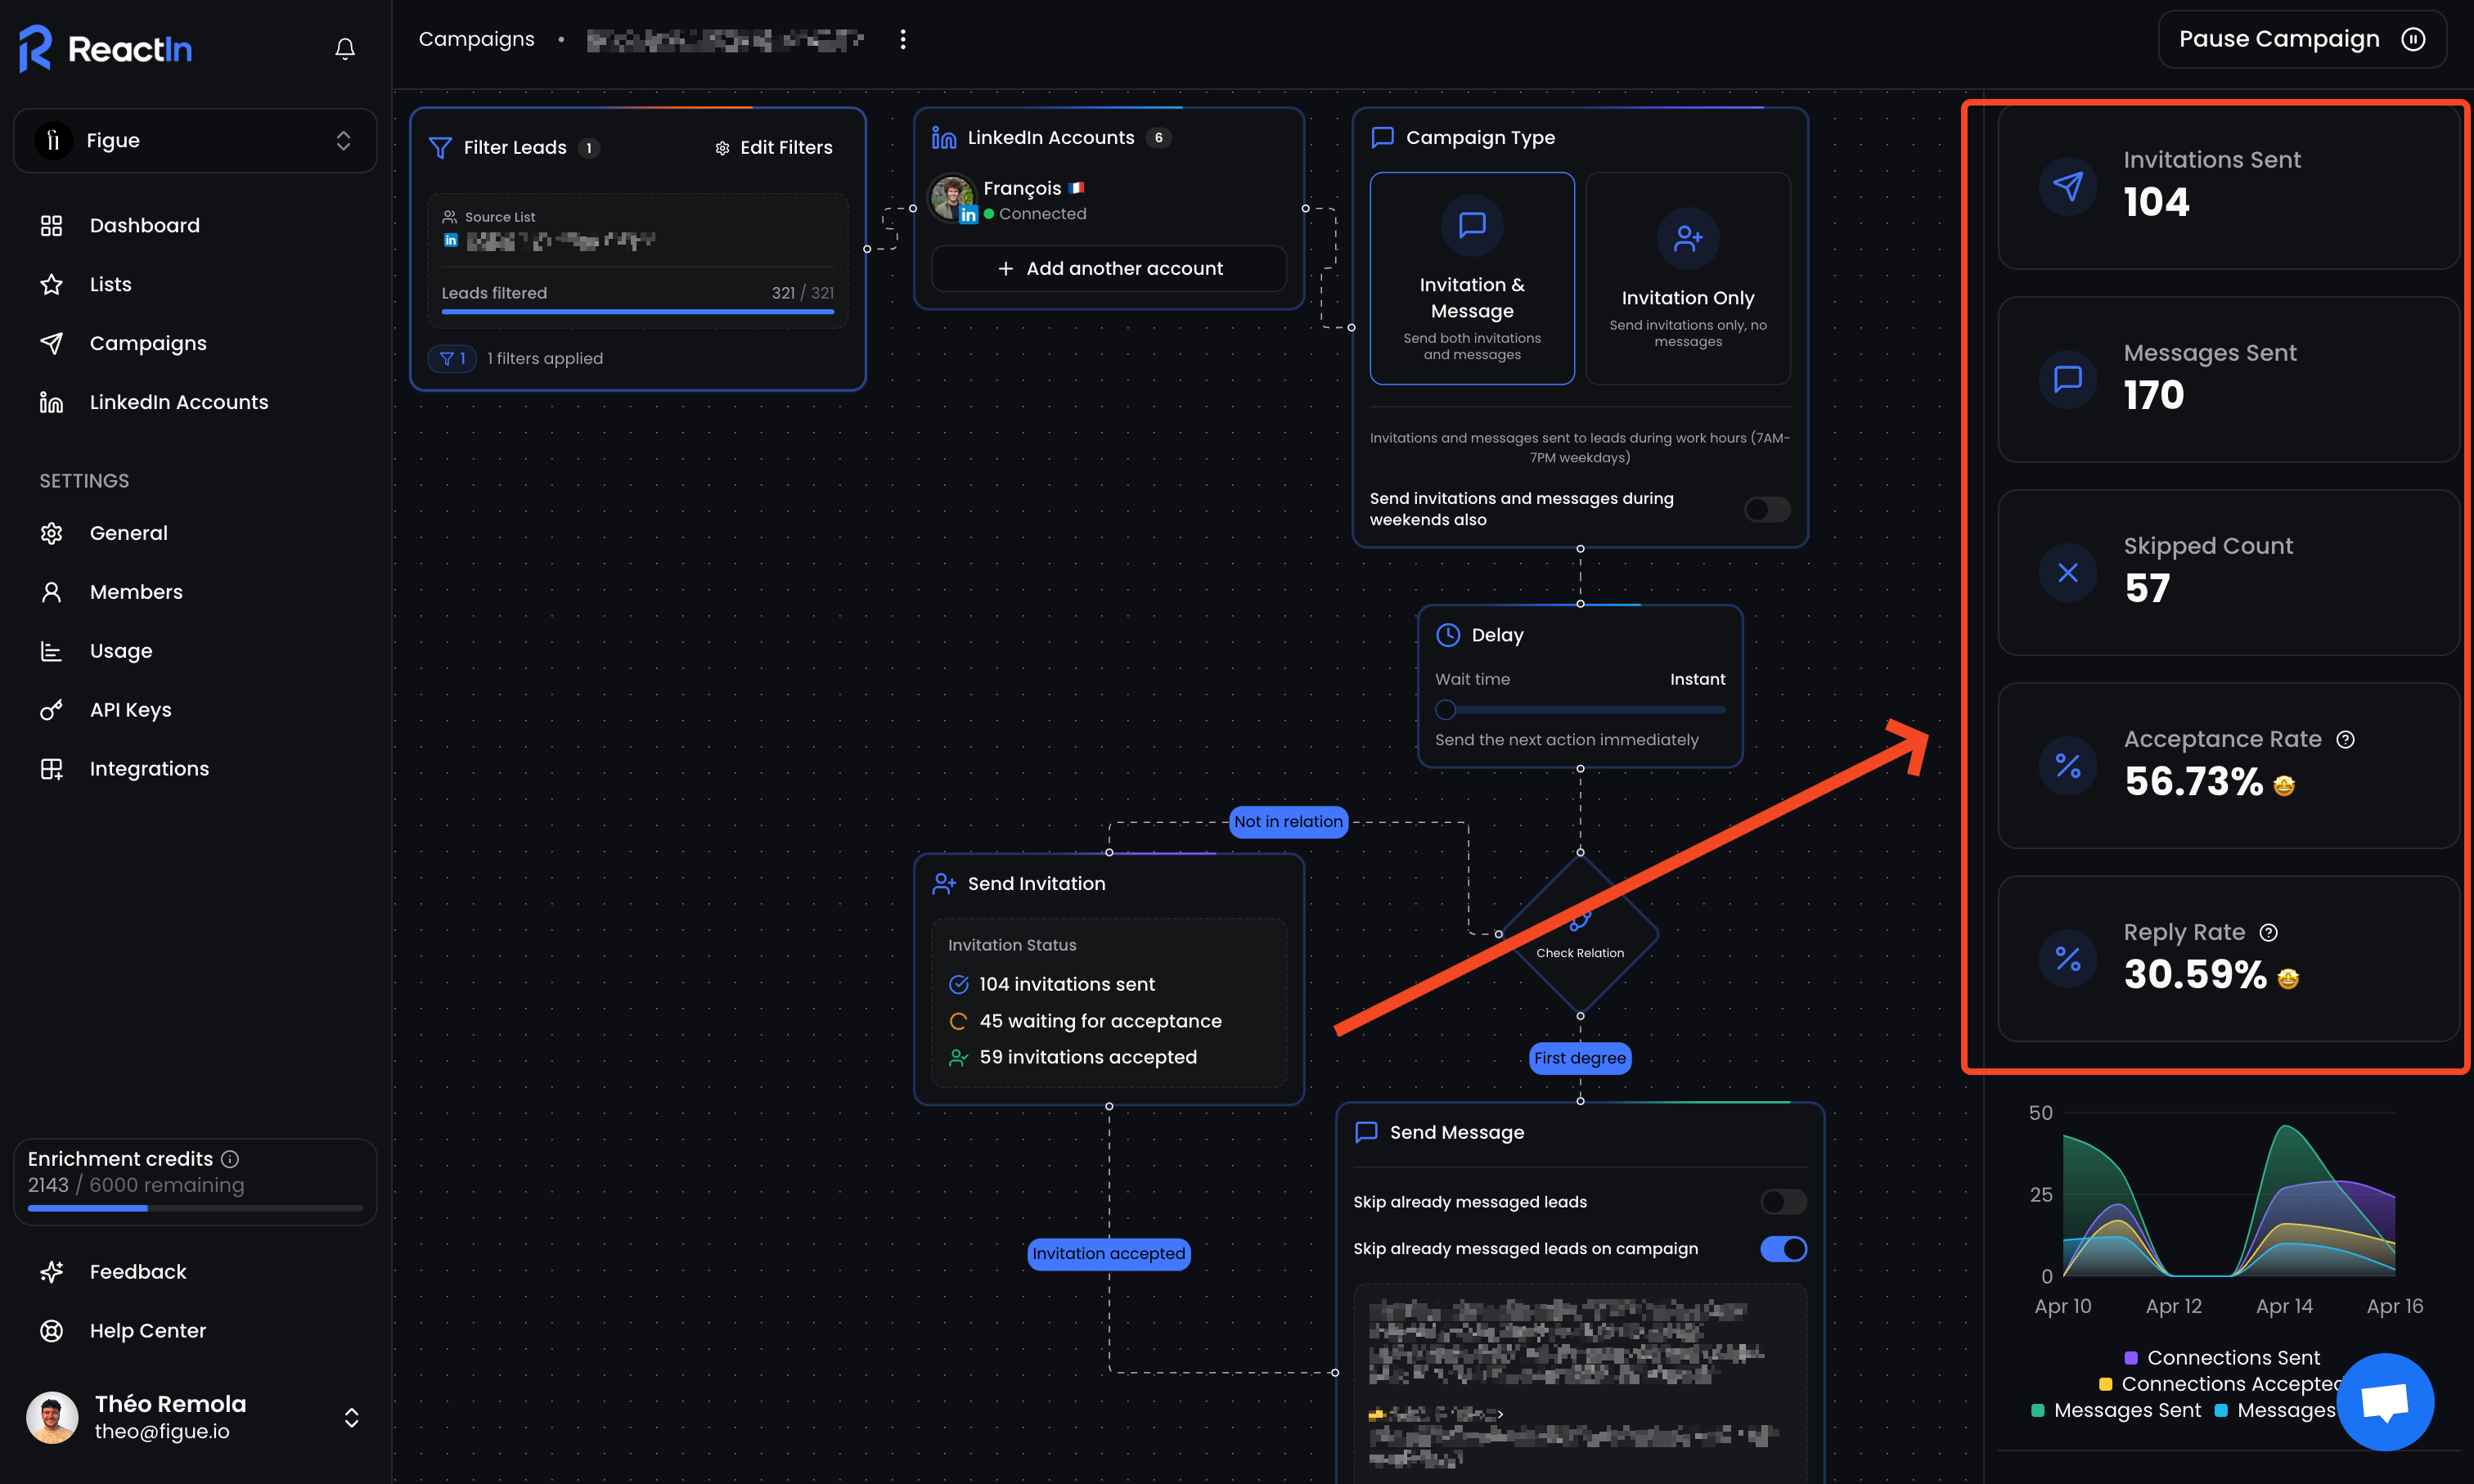
📈 Data updates continuously as actions are performed.
📆 Time-based view
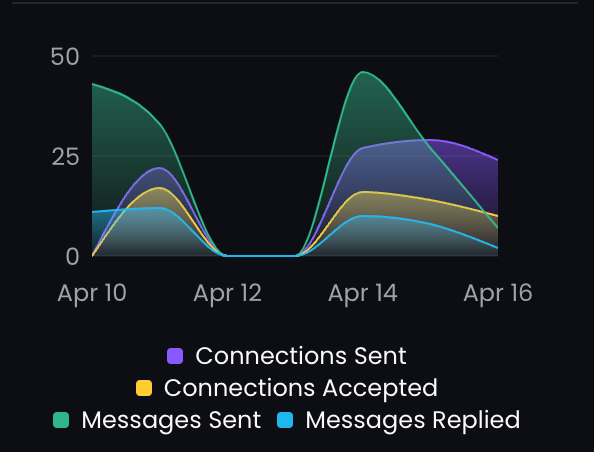
You can visualize performance over time on the graph
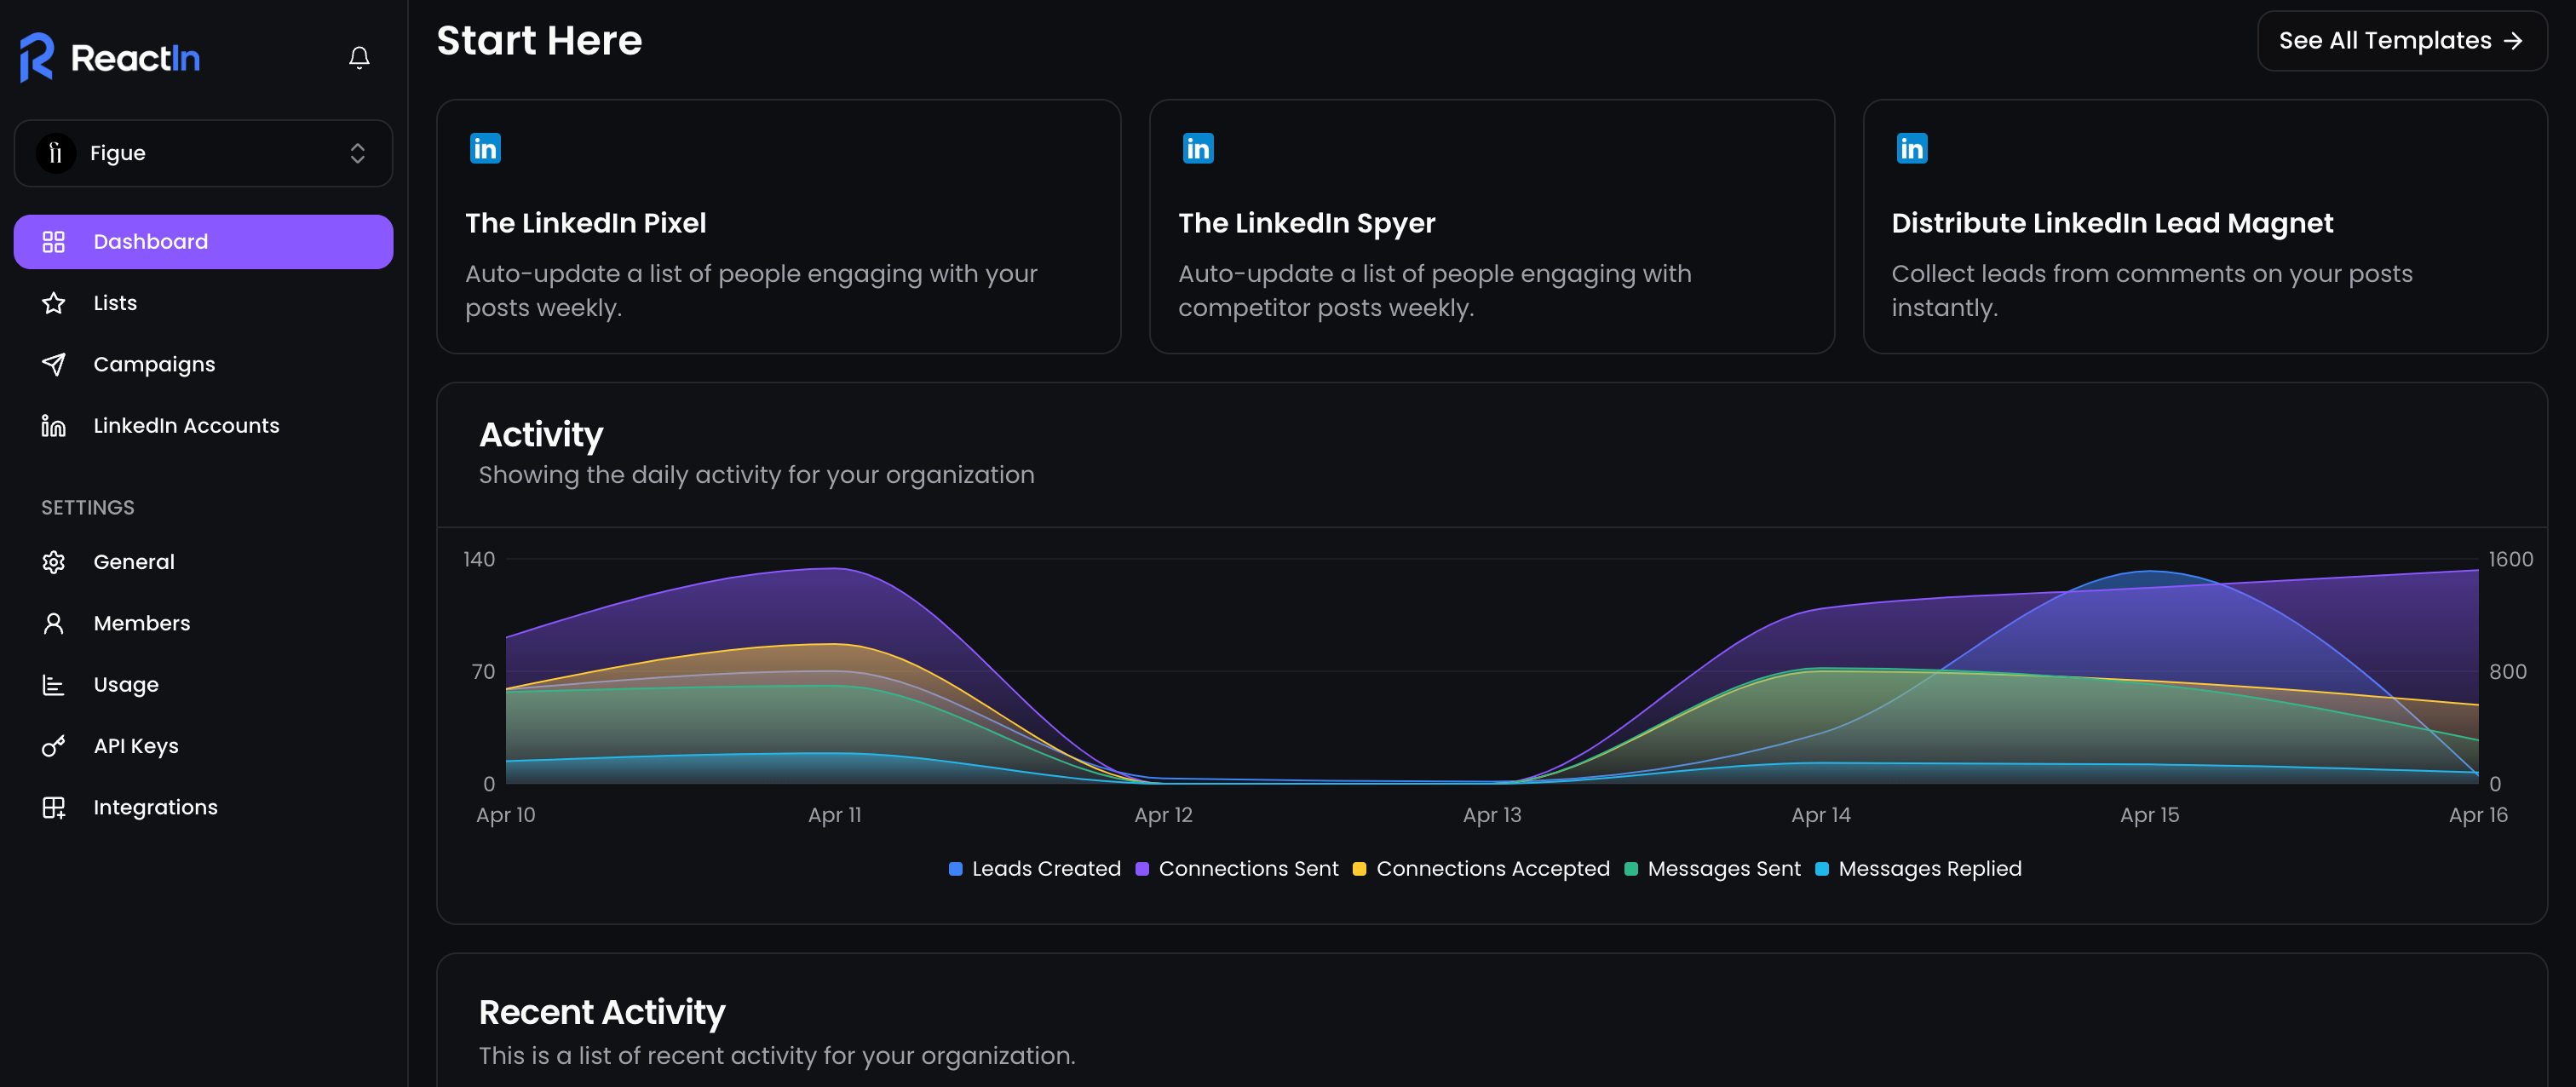
You can also track the global performances of the whole organization on your dashboard:
🔍 Use these stats to improve
-
Low acceptance rate? → Rework your invite message or target audience
-
Low reply rate? → Test new message angles, variables, or custom follow-ups
-
High drop-off after message 1? → Add more value or a clearer CTA
🧠 Combine stats with SmartList filtering to see patterns by persona or industry.
You can also segment your SmartLists to test messages by persona, industry, or company size.
💡 Pro tip: Start with a 50-lead test to optimize messaging before scaling.
Ready to move on?
👉 Next Step: Manage Team Members & Permissions →